Create a map of connecting locations. Here I connect the cities I lived in for more than 12 months. The code is based on this blog post.
Load packages and prepare background layer.
library(dplyr)
library(geosphere)
library(rworldmap)
library(ggplot2)
library(sp)
library(raster)
library(leaflet)
library(htmlwidgets)

#word layer
d<-countriesLow
d.world<-d
Input the location GPS points and add some description. For example like this:
d<-data.frame(rbind(
  c("New York","1985","2000",40.71276540234597, -74.0456328385508),
  c("Berlin","2000","2005",52.53116489688758, 13.383507164538456)
),stringsAsFactors=F)
Convert GPS points to Point layer.
names(d)=c("city","start","end","lat","long")
d$long<-as.numeric(d$long)
d$lat<-as.numeric(d$lat)
d.coords<-d

#cities
d<-d.coords
d<-SpatialPointsDataFrame(
  coords = d[,c("long","lat")],
  data=d[,c("city","start","end")],
  proj4string=CRS("+proj=longlat +datum=WGS84 +ellps=WGS84 +towgs84=0,0,0")
)
d$label<-paste(d$city,paste(d$start,"-",d$end),sep = "<br/>")
d.cities<-d
Create connections between GPS points.
#connections
d<-d.coords
d$start<-lag(d$city)
d$end<-d$city
d$lat1<-d$lat
d$long1<-d$long
d$lat2<-lag(d$lat)
d$long2<-lag(d$long)

d<-d[,c("start","end","lat1","long1","lat2","long2")]
d<-d[-1,]
d$conid<-1:nrow(d)
d.conn<-d

#paths
a<-lapply(
  1:nrow(d.conn),
  function(i){
    # i<-1
    x<-d.conn[i,]
    rownames(x)<-1
    p<-gcIntermediate(x[c("long1","lat1")],x[c("long2","lat2")], n=50, addStartEnd=T, breakAtDateLine=F)
    l<-spLines(p)
    l<-SpatialLinesDataFrame(l,data=x[,c("conid","start","end")])
    return(l)
  }
)
a<-do.call("rbind",a)
# a
d.paths<-a
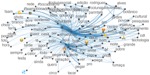
Create a map figure.
##plot
p<-ggplot() +
  theme_bw() +
    geom_polygon(data=fortify(d.world), aes(x=long,y=lat,group=group),fill="#f2f2f2",color="white")  +
    geom_point(data=data.frame(d.cities), aes(x=long,y=lat),color="red") +
    geom_line(data=fortify(d.paths), aes(x=long,y=lat,group=group),color="slateblue")
# ggsave(p,filename="places-lived.jpg",device="jpg",units="mm",width=150,height=80)
# p
Create a leaflet map.
##leaflet
p<-leaflet() %>%
  # addTiles() %>%
  addProviderTiles(providers$Stamen.Toner) %>%
  addPolylines(data=d.paths,color="slateblue") %>%
  # addCircles(data=d.cities,radius=30,color="red")
  addCircleMarkers(
    data=d.cities,
    # radius=10,
    fillColor="red",color="red",stroke=F,fillOpacity=0.7,
    label=lapply(d.cities$label,htmltools::HTML)
    # label=~start#,
    # labelOptions = labelOptions(noHide=T, offset=c(0,0), textOnly=F)
  )
  # addMarkers(data=d.cities,label=~city)
saveWidget(p, 'places-lived.leaflet.html', selfcontained = TRUE)
# p