Code: Google Tracking meets leaflet heatmap
Building a heatmap using data gathered by Google GPS tracking. Craig Eric Simpkins shared his code snippet with me, and there are many more examples, see for example here and here.
First get your data from https://takeout.google.com/. Select “Location History” in JSON format ONLY.
library(jsonlite)
library(leaflet)
library(leaflet.extras)
library(tidyverse)
library(lubridate)
library(colorRamps)
library(mapview)
library(htmlwidgets)

#Import data and convert it to Rds - this can take a while
if (file.exists("Takeout/Standortverlauf/Standortverlauf.Rds")!=T){
  d<-fromJSON("Takeout/Standortverlauf/Standortverlauf.json")
  saveRDS(locationdata, file.path(dfolder,"Standortverlauf.Rds"))
}
d <- readRDS("Takeout/Standortverlauf/Standortverlauf.Rds")

#Select only the relevant columns
d <- d$locations %>%
  select(latitudeE7, longitudeE7, `timestampMs`, velocity)

#Make data more viz friendly
d <- d %>%
  mutate(lat = latitudeE7 / 1E7, lon = longitudeE7 / 1E7) %>%
  mutate(timestampMs = as.numeric(timestampMs)) %>%
  mutate(Date = as.POSIXct(timestampMs/1000, origin="1970-01-01"))

#convert Date column to date format
d$Date<-as.Date(d$Date)

#Check the time frame
c(min(d$Date), max(d$Date))
## [1] "2013-08-29" "2018-10-28"
#And filter to just the date range you want
i<-which(d$Date > as.Date("2016-08-15") & d$Date < as.Date("2019-01-28"))
length(i)
## [1] 81982
df<-d[i,]
c(min(df$Date), max(df$Date))
## [1] "2018-06-18" "2018-10-28"
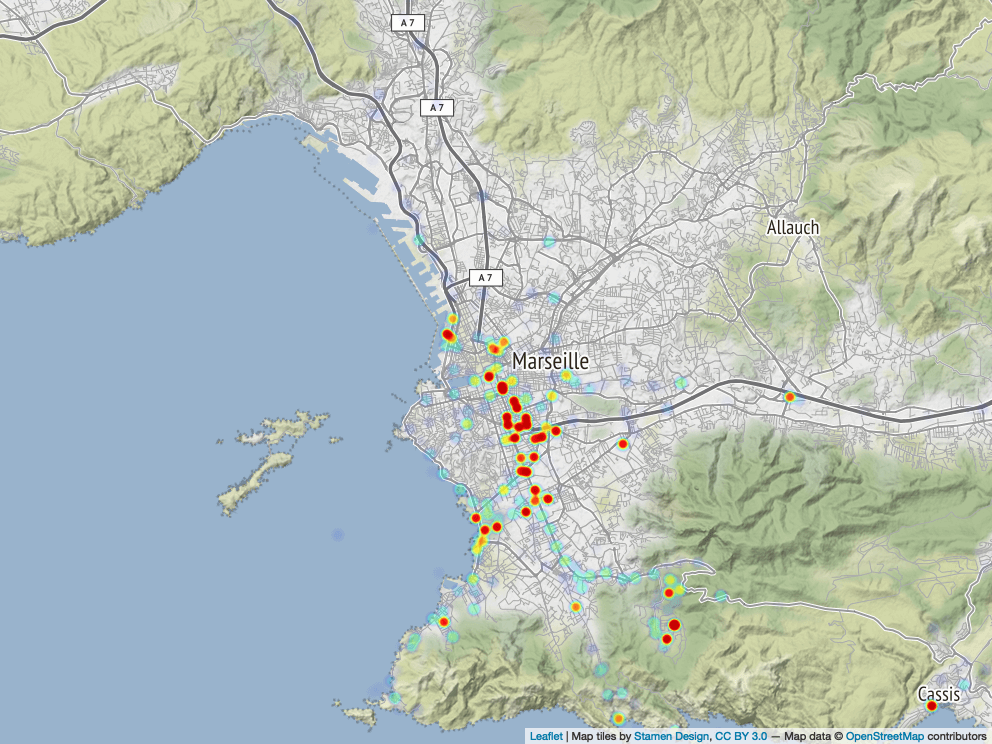
#Make a simple map
HeatGradient <- matlab.like2(5000)

m <- leaflet(df) %>%
       setView(5.3810700, 43.2969500, 12) %>% #lon, lat, zoom #Need to pick your location
       addProviderTiles(providers$Stamen.Terrain) %>%
       addHeatmap(
         lng = ~lon,
         lat = ~lat,
         blur =5,
         max = 20,
         radius = 6,
         gradient = HeatGradient,
         cellSize = 15
       )

# m

#Export
saveWidget(m, 'google-heatmap_selfcontained.html', selfcontained = T)
mapshot(m, file = "google-heatmap.png")